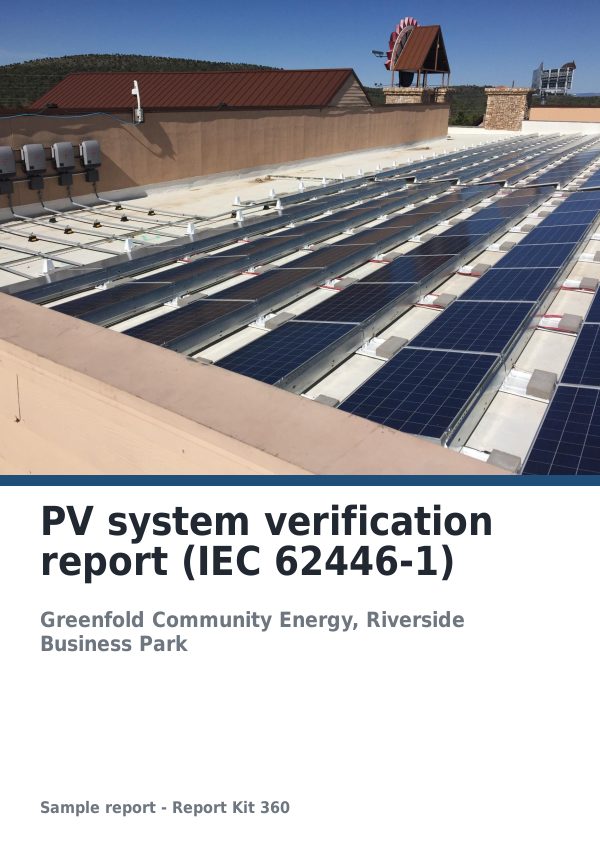
IEC 62446 is the series most UK solar installers, inspectors and asset managers work to when a grid-connected PV system is commissioned, inspected or maintained. Part 1 covers the documentation, commissioning tests and inspection of a system; the technical specification Part 3 covers outdoor infrared thermography of modules and plant. Both are purchased standards and this post does not reproduce them. It summarises, in our own words, what a report written in their pattern has to contain, and where the arithmetic usually goes wrong.
Report Kit 360 is not affiliated with or endorsed by the IEC. The solar PV template follows the structure described here in our own wording; the tests you perform and the judgements you make remain yours.
Three parts, three audiences
A PV inspection report in the IEC 62446 pattern serves three readers. The system owner wants to know whether the array is safe and performing. The O&M contractor wants a list of anomalies with locations and actions. A future inspector wants the system data and the previous results so they can compare. A report that keeps those three things in separate parts serves all of them.
Part A: system data and documentation
Part 1 of the standard puts a strong emphasis on documentation: the system should be described well enough that someone who was not there can understand it. In practice that means recording the site and owner, the installer, the module and inverter models and quantities, the array layout and string configuration, the protective devices and earthing arrangement, and which documents were available for review (single-line diagram, datasheets, previous test records, the commissioning certificate).
Missing documentation is itself a finding. If the string layout was not available and had to be traced on site, say so.
Part B: inspection and tests
The inspection is a visual and mechanical check of the DC and AC sides: module condition, fixings, cable management, labelling, enclosures, isolation and protective devices. The standard sets out categories of testing; the routine set that most periodic inspections perform includes continuity of protective conductors, polarity, string open-circuit voltage and short-circuit current, insulation resistance of the DC circuits and functional checks of the inverter and protection.
This is where the numbers matter, and where a report can quietly go wrong:
- Open-circuit voltage should be compared with the expected value for the string, corrected for the module temperature at the time of the test. A reading more than a few per cent away from expected, after correction, points at a missing or shaded module, a bypass diode or a connection fault. A table that lists readings without the expected value and the difference is not a test record; it is a list of numbers.
- Insulation resistance has a pass threshold that depends on the system voltage. Recording the test voltage and the threshold used, and showing pass or fail per string, removes the argument later.
- Irradiance and module temperature at the time of each measurement should be recorded, because without them the readings cannot be compared with the next inspection.
In Report Kit 360 the string test table is a formula table. You enter the expected Voc, the measured values, the test voltage and the readings; the table calculates the percentage difference, flags anything outside the template’s 5 per cent band and marks insulation resistance pass or fail by band. The flags are live, so a mistyped reading is caught on site rather than in the office.
Part C: thermography
Part 3 of the series describes outdoor thermographic inspection of PV modules and the conditions under which the results are meaningful. The principle is simple: a thermal image taken in poor light or high wind tells you little, so the conditions have to be recorded and have to meet minimums. The specification deals with minimum irradiance, wind, cloud cover, camera specification and calibration, viewing angle and distance, and the way anomalies are classified and reported.
The template encodes those as checks. Its defaults are a minimum in-plane irradiance of 600 W/m², a maximum wind of 4 on the Beaufort scale, a maximum cloud cover of 2 okta and camera calibration within 2 years. If the conditions you record fall outside them, the Checks panel says so and the thermography annex cannot be issued as a clean result. Pro workspaces can save the template and adjust the gate values to their own procedure.
Each anomaly then goes in a register with its location (string and module), the type of pattern, a class of abnormality, the temperature difference normalised to a reference irradiance and the recommended action. The thermal block holds the infrared and visible image together with the palette legend, spot and area temperatures, emissivity and reflected temperature, so the evidence for each register entry is complete on one page.
The report structure, in order
- Cover and document control.
- Summary: safe or not, performing or not, the count of anomalies by class and the actions required.
- Part A: system data and documents reviewed.
- Part B: inspection checklist with results and photo references; string test table with expected values, readings, differences and flags.
- Part C: thermography conditions, equipment, method, thermal pairs and the anomaly register.
- Conclusions and recommendations, with re-test advice.
- Signature and appendices (single-line diagram, previous certificates, merged as PDF pages).
Where the arithmetic usually goes wrong
From reviewing PV reports, the recurring faults are the same:
- Readings with no expected value and no temperature correction, so the comparison is meaningless.
- Insulation resistance recorded without the test voltage.
- Thermal images with no irradiance or wind noted, so the anomaly cannot be assessed.
- ΔT quoted raw rather than normalised, so a hot spot at 400 W/m² looks milder than the same fault at 900 W/m².
- Anomalies photographed but not located, so the O&M team cannot find the module.
Every one of those is a structure problem rather than a competence problem, and every one is solved by a template that will not let the field be blank. That is the whole argument for using one.
Commissioning versus periodic inspection
The same structure works for both. At commissioning, Parts A and B carry the weight: the documentation set, the initial inspection and the full test results that become the baseline. At periodic inspection, Part B is repeated and compared, and Part C is added where a thermographic survey is in scope. Keep the baseline report attached to the client record so the comparison is one click away.
Plan note
The solar PV template is a Pro template because it relies on formula tables, calculated fields and the thermal block. Pro is £49 a month with no limit on reports, which suits portfolio work. A Basic workspace can still record a PV inspection in the generic technical template with static tables and plain images; the automatic flags, the gates and the thermal pairs are what Pro adds.
Report Kit 360 is a trading name of [Digital Depth Studio Ltd]. It is not affiliated with or endorsed by the IEC. IEC 62446-1 and IEC TS 62446-3 are published standards available from the IEC and national standards bodies; this post summarises their structure and does not reproduce their content.